- Home
-
Study with us
Study with us
We make sure that every student has a hands-on education that’s filled with adventure.
Learn more -
Uni life
Uni life
There’s more to uni than studying. Learn how you can connect with new people through events, sports, volunteering opportunities, and more.
Learn more -
Our research
Our research
We are proud of our research excellence, which delivers impact for and from Tasmania.
Learn more -
For community & partners
For community & partners
We pride ourselves on forming deep connections, collaborating not just with one another, but with local industry, schools, and everyone who calls our island home.
Learn more -
About us
About us
Tasmania is an island of creative and curious minds. No matter where you join us from, you’ll become part of a welcoming and collaborative community.
Learn more
I'm interested in
Are you an international student?
We want to provide content that's relevant to you. Your options are stored in a browser cookie which you can delete at any time via the link below.
Choose a login
Search
9,231 -
9,250 of
26,480
search results
Fully-matching results
-

Aurora Australis in a nutshell
https://www.utas.edu.au/about/news-and-stories/articles/2023/aurora-australis-in-a-nutshell27 Jun 2023: As the gateway to the world’s southernmost wilds, Tasmania’s unique location and thriving scientific community attract students and researchers from every corner of our blue-green planet. Studying in Tasmania also gives you a front-row seat to -
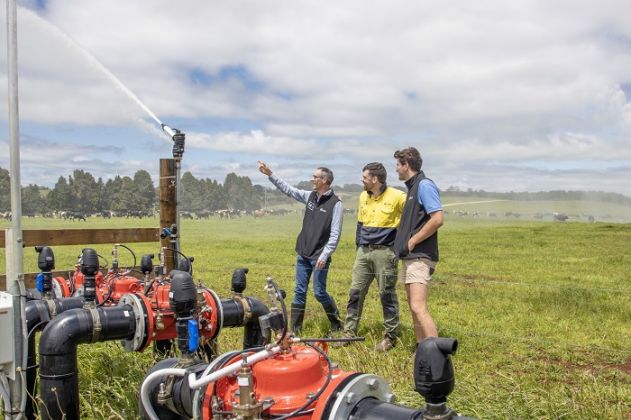
TIA 2022 Highlights Report
https://www.utas.edu.au/about/news-and-stories/articles/2023/tia-2022-highlights-report3 Jul 2023: The Tasmanian Institute of Agriculture’s 2022 Highlights Report has been released. This 60-page document contains highlights from our research, industry development, and education endeavours, along with a comprehensive list of research projects and -
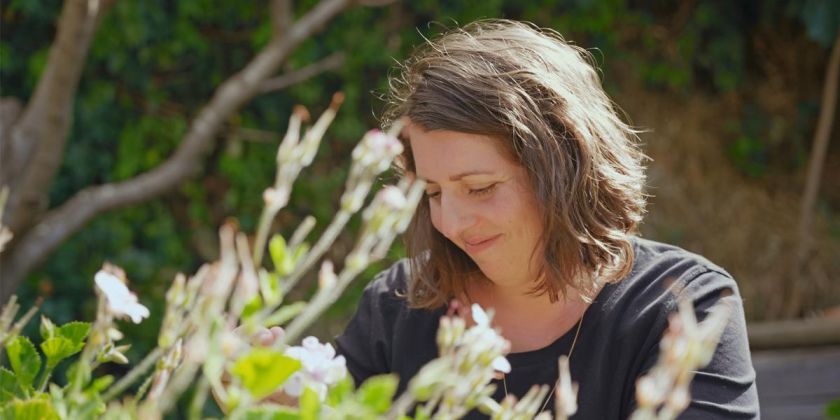
Sustainable Living courses that can help you make your own home and…
https://www.utas.edu.au/about/news-and-stories/articles/2023/sustainable-living-courses-that-can-help-you-make-your-own-home-and-garden-more-sustainable5 Jul 2023: Saving the planet starts in your own backyard and the University of Tasmania’s Sustainable Living course can equip you with everything you need to know to put your green thumb to work. Most people choose to study the Diploma of Sustainable Living -
Tasmanian abalone fishery assessment 2019 Craig Mundy and Jaime ...
https://www.utas.edu.au/__data/assets/pdf_file/0017/1342061/AbAssessFY2019_Web.pdf19 Aug 2020: Tasmanian abalone fishery assessment 2019. Craig Mundy and Jaime McAllister. August 19, 2020. This assessment of the TasmanianAbalone Fishery is produced by the Institute for Marine andAntarc-. tic Studies. The authors do not warrant that the -
Example 2 Write an equation to represent the following ...
https://www.utas.edu.au/__data/assets/pdf_file/0009/521748/BI2.2.pdf11 Apr 2014: Example 2. Write an equation to represent the following situation:. There are 6 students for every professor. Solution:. Let the number of students be S and let the number of Professors be P. The total. number of students is equal to six times the -
As you can see from the shapes in the ...
https://www.utas.edu.au/__data/assets/pdf_file/0009/462573/BI1-2.pdf14 Feb 2014: As you can see from the shapes in the table, a rhombus also has four sides of equal. length, and therefore is a regular shape. It is just like a square that has been pushed. out of shape. The square and the rhombus are the only regular quadrilaterals -
Big Idea 1 Learning Activity 1 Questions: 1. What ...
https://www.utas.edu.au/__data/assets/pdf_file/0005/542183/BI1.1.pdf28 May 2014: Big Idea 1 Learning Activity 1 Questions:. 1. What is the most common reason given as to why international visitors come to Australia? 2. What percentage of visitors came to Australia for employment opportunities? 3. What is the total number of -
Big Idea 1 Learning Activity 3 Questions: 1. Name ...
https://www.utas.edu.au/__data/assets/pdf_file/0005/525587/BI1.3.pdf28 Apr 2014: Big Idea 1. Learning Activity 3. Questions:. 1. Name two activities that showed a steady increase in participation rates. for males and females for each of the intervals across 2006-2012? 2. The male participation rate for “Reading for pleasure” -
Big Idea 1 Learning Activity 3 Questions: 1. What ...
https://www.utas.edu.au/__data/assets/pdf_file/0005/524903/BI1.4.pdf23 Apr 2014: Big Idea 1. Learning Activity 3. Questions:. 1. What is the lowest unemployment rate during the period 2002-2012 and. in which year did it occur? 2. In 2002 the unemployment rate for males was greater than the. unemployment rate for females. In -
Big Idea 2 Learning Activity 2 Questions: 1. How ...
https://www.utas.edu.au/__data/assets/pdf_file/0009/525573/BI2.1.pdf28 Apr 2014: Big Idea 2 Learning Activity 2 Questions:. 1. How many different types of cereal are made by Sanitarium? 2. Which manufacturer makes the most different types of cereal? Answers:. 1. There are 20 different types of cereal made by Sanitarium. 2. Uncle -
Big Idea 2 Learning Activity 2 Questions: 1. Which ...
https://www.utas.edu.au/__data/assets/pdf_file/0011/525575/BI2.2.pdf28 Apr 2014: Big Idea 2 Learning Activity 2 Questions:. 1. Which shelf has the most breakfast cereal products on it? 2. Which manufacturers only have breakfast cereal products on the middle. shelf? 3. What conclusions can be drawn from seeing that Woolworths’ -
Big Idea 2 Learning Activity 2 Questions: 1. If ...
https://www.utas.edu.au/__data/assets/pdf_file/0018/525114/BI2.3.pdf24 Apr 2014: Big Idea 2 Learning Activity 2 Questions:. 1. If you were trying to make a healthy cereal choice, which manufacturer would you choose and why? 2. How many breakfast cereal products have 10 grams or more of sugar per 100 grams of breakfast cereal? 3. -
Big Idea 2 Learning Activity 2 Questions: 1. What ...
https://www.utas.edu.au/__data/assets/pdf_file/0010/524908/BI2.4.pdf23 Apr 2014: Big Idea 2. Learning Activity 2. Questions:. 1. What is the range of the sugar level that has the most breakfast cereal. products? 2. What conclusions can be drawn from the graph about the placement of. the breakfast cereal products on the shelves? -
Big Idea 2 Learning Activity 2 Questions: 1. What ...
https://www.utas.edu.au/__data/assets/pdf_file/0011/524918/BI2.5.pdf23 Apr 2014: Big Idea 2. Learning Activity 2. Questions:. 1. What is the range of the sugar content in the breakfast cereals? 2. From the graph, estimate the average sugar content of the breakfast. cereal products. Answers:. 1. The sugar content ranges from 0-49 -
Big Idea 2 Learning Activity 2 Questions: Graph 1-5 ...
https://www.utas.edu.au/__data/assets/pdf_file/0003/524919/BI2.6.pdf23 Apr 2014: Big Idea 2. Learning Activity 2. Questions:. Graph 1-5 display data about the same products. 1. Which graphs display categorical data? 2. Which graphs display numerical data? 3. Which graphs display a combination of both categorical and numerical. -
Big Idea 3 Questions: 1. What is the mean ...
https://www.utas.edu.au/__data/assets/pdf_file/0004/524920/BI3.1.pdf23 Apr 2014: Big Idea 3. Questions:. 1. What is the mean maximum temperature for Hobart in June? 2. Which month is Hobart likely to get the most rain? 3. What was the temperature in Hobart when it experienced its hottest. maximum temperature? 4. What is the -
Big Idea 3 Questions: 1. Complete the table Type ...
https://www.utas.edu.au/__data/assets/pdf_file/0005/524921/BI3.2.pdf23 Apr 2014: Big Idea 3. Questions:. 1. Complete the table. Type of Dish Number of. Dishes Fraction Decimal Percentage (%). Beef 7. 0. 2 20. Fish/Seafood 5. 0. 14 14. Chicken 9. 0. 26 26. Vegetarian 2. 0. 06 6. Meat & Vegetable Combinations. 12. 0. 34 34. Total 35 1 1 -
Big Idea 3 Learning Activity 2 Questions: 1. In ...
https://www.utas.edu.au/__data/assets/pdf_file/0007/524923/BI3.3.pdf23 Apr 2014: Big Idea 3. Learning Activity 2. Questions:. 1. In general, was 1890 a wetter year than 2013 on Bruny Island? Use details. from the graph to justify your answer. 2. Which months of the year support your conclusion? 3. What months of the year -
Big Idea 3 Learning Activity 4 Questions: 1. What ...
https://www.utas.edu.au/__data/assets/pdf_file/0008/525581/BI3.4.pdf28 Apr 2014: Big Idea 3 Learning Activity 4 Questions:. 1. What is the range of the data for the boys in the class? 2. Which is the active heart rate for the girls that occurs the most? 3. Compare the boys’ active heart rates with the girls’ active heart -
Big Idea 3 Learning Activity 4 Questions: 1. What ...
https://www.utas.edu.au/__data/assets/pdf_file/0004/525577/BI3.5.pdf28 Apr 2014: Big Idea 3 Learning Activity 4 Questions:. 1. What effect does temperature and wind speed have on the ozone levels? 2. What percent of the days in these data had ozone levels that exceeded. the EPA limit of 120 ppb? 3. What percent of the days in
Refine your results
- Coming year 46
- Coming month 36
- Coming week 13
- Tomorrow 3
- Past week 231
- Past fortnight 375
- Past month 6,881
- Past 3 months 10,518
- Past 6 months 11,179
- Past year 12,478
- Uncertain 3,186
- 2025 1
- 2024 11,867
- 2023 3,472
- 2022 1,279
- 2021 990
- 2020 1,689
- 2019 497
- 2018 764
- 2017 375
- 2016 297
- 2015 331
- 2014 153
- 2013 80
- 2012 1,367
- 2011 105
- 2010 13
- 1970 14
Back to results
Shortlist
Clear
all
Back to results
History
Recently clicked results
Clear
all
Recent searches
Clear
all
The University of Tasmania uses cookies to deliver content that’s relevant to you. We rely on cookies to remember your preferences, provide personalised content, and to analyse our website traffic. You consent to our cookies if you click “Accept”. Please refer to our privacy policy for more information.
- Essential functionality (required) - these cookies are needed for this website to run and are always turned on.
- Personalisation and preferences - these cookies help us remember your preferences and deliver a more personalised experience.
- Personalisation and analytics - these cookies help us gather non-identifiable data about the way our site is used and to help us make improvements.
- Marketing and promotion